Many of the nonprofits we work with exist in very niche markets – either due to their size, the scope of their work, the specific cause they support, or the location of their constituent base. Because of this, many of the best practices and metrics supplied through major online resources do not apply to them.
So how do we create baselines and comparative numbers for our clients? Easy – we look at their competition.
Some nonprofits blush at the idea of competition, fearing that defining their fellow nonprofits in this way runs against the purpose of the work they are doing. But think of it this way – what other organizations are speaking to your same audience, asking your constituents for money, or sharing information with them via social media? You are competing with these organizations for the attention and money from your base – even if you don’t like to define it as such.
Tracking your competition’s performance takes time, but is not as difficult as it may seem. By creating a game plan to collect this data, you will be well on your way to having a better understanding of how your peers are using the tools and networks you are using on a daily basis.
Here is our step-by-step approach to assessing competitor:
Review your criteria to define “competitor”
Geographic location, mission, constituent base, size, and income sources are all valid measurements of defining who is your nonprofit’s competition.
One feature we like to include is total income based on the previous year’s IRS 990 submission. This information is easily available via Guidestar.
Why include this information? While this number doesn’t represent how much the organization spent on social media, it can show you what other smaller organizations are able to accomplish given the amount of money they received in the past year. By doing so, you can better compare your current social media status beyond the metrics included in social media.
Define what metrics you want to track
Social media networks make it easy for you to see the performance of a post or page thanks to their public displays of engagement – Facebook, Twitter, Pinterest, Tumblr, and Instagram all show likes, shares, retweets etc. for posts that anyone can see.
First, you need to decide what networks you would like to track. Second, you need to determine what measures within those networks are available to you as an outsider, and what values you think are important.
In addition to standard social media insights, metrics we have typically monitored in the past include the topic of the post, whether or not the content included a picture, where links in the post were directed, and whether or not the post promoted another organization or business.
One of the main features we track on Facebook is what we call “peer engagement” – for example, we define this as the total number of comments, likes, and shares, divided by the number of likes the organization has. By calculating this number, you can see if their posts are being received and shared by their audience, or if they are falling flat.
In addition to definitions, it is also important to decide how long you want to assess your competitors. We usually capture data for a minimum of three months in order to collect meaningful data to be reviewed at the end.
Set up your spreadsheet
Because you will be tracking other organizations, useful tools such as Hootsuite and Sprout won’t be able to help you monitor their numbers. But even without these tools, you can easily track this information by following one of our main adages at Social Change Consulting – when in doubt, use a spreadsheet.
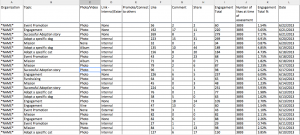
We’ve included a sample spreadsheet below, to show how we tracked data for one competitor:
By using formulas, you can also easily track the metrics we defined above. For example, if calculating “peer engagement,” simply setup your cell by using the following formula:
= (sum of cells including # of likes + # of comments + #shares)/(total fans) *100
By using a spreadsheet, you’ll be easily able to sort columns to determine which post types and dates garnered the most attention to better understand when and how your competition receives its best results.
Make the time
All of your preparation for this project will be useless without setting aside time every week to monitor your competitors. Whether you assign this project to yourself or to someone else on your team, be sure to set aside at least an hour each week to track this data.
Review your results
Now that you’ve collected your data, it is time to assess what it all means. Data shouldn’t determine your actions on its own, but it can definitely help inform future decisions as it relates to your social media content creation and distribution. Do your competitors fare better when they share an update with a picture of their work? Then it might be time to start collecting more photos and media to share along with your content. Does your competition rarely post on the weekends? This might be an area where you can stand out by being one of the few in your field sharing stories during this time.
Any nonprofit can benefit from knowing what their peers are accomplishing on social media – it just takes a little bit of time to set up the data and metrics needed to do so. By knowing how your competitors are performing, you can better tell board members, executives, volunteers, and fellow staff members how successful you are at social media, earning your place in the organization for years to come.
